Automated End-to-End Encrypted Curator Backups for Massively-Scaled Elasticsearch, Part 2: Centralizing, and Alerting on, Curator logs with Rsyslog, Kibana and X-Pack Watcher
January 31, 2019
elasticsearch curator aws puppet rsyslog elasticsearch watcher![]()
Introduction
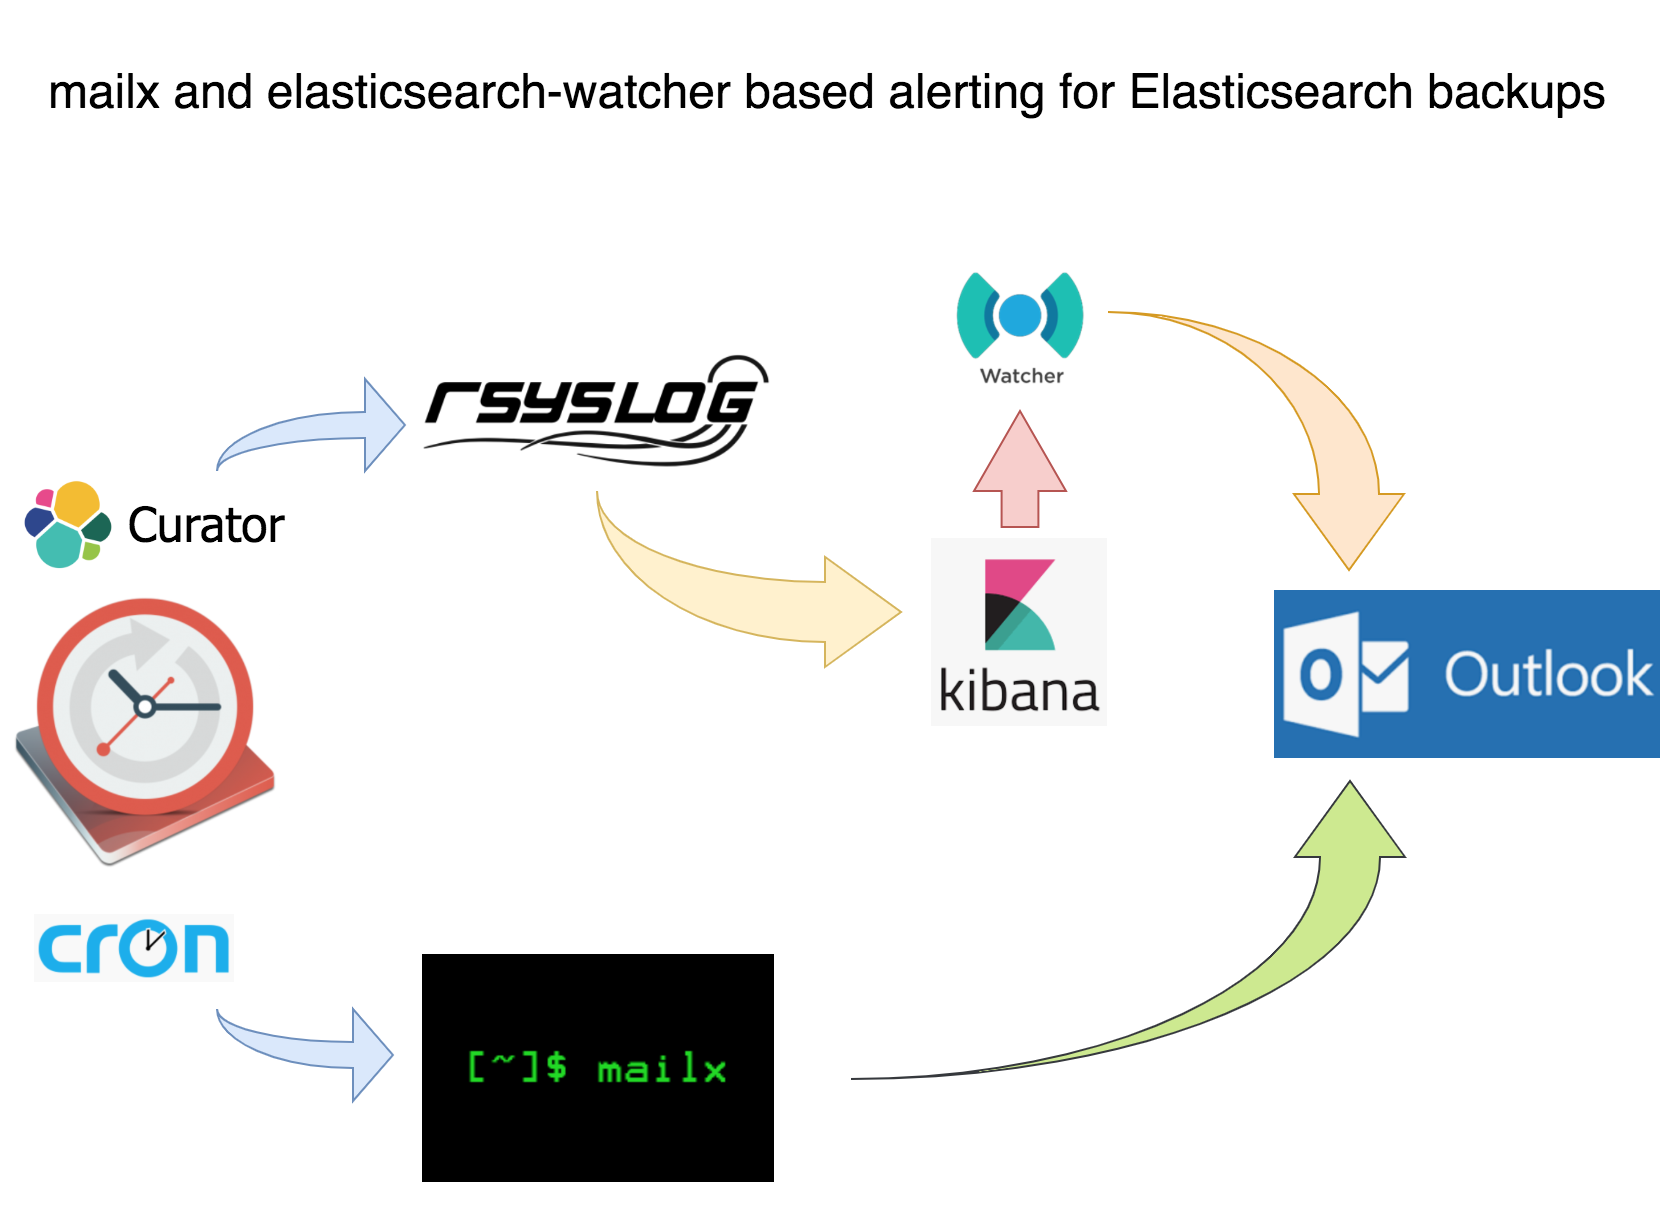
This is part 2 of a 2-part series on automating end-to-end encrypted Elasticsearch Curator backups with Puppet, AWS S3, Rsyslog, Kibana and X-Pack Watcher. The first part covered automating end-to-end encrypted curator backups using Puppet and AWS S3. This part covers monitoring and alerting on backup success with Rsyslog, Kibana and X-Pack Watcher:
Motivation
The main motivation for part 2 of this series is because Reddit said it was pointless to use Rsyslog despite Rsyslog being one of the most stable and mature shippers ever and so in the interest of FOSS support I made an attempt…and succeeded!
Requirements
CentOS 7 (it was also tested on 6; needs very minimal tweaking)
tested on Elasticsearch 5 & 6
Rsyslog rsyslog-8.24.0-16.el7.x86_64.rpm (which we are going to patch!!!)
Not a requirement but this tut uses Kibana
Not a requirement but if you have a paid elasticsearch license consider the Watcher section
Caveats
Rsyslog’s RPM doesn’t work with elasticsearch at all. This will not be fixed until at least RHEL 8 which you can read about in this bugzilla report. Nonetheless, as supporters of FOSS we must stay calm and patch on! If you want to skip the patching section and simply download the source RPM and update the SPECS/rsyslog.spec file with your name and address on line 592 be my guest, however, a word of caution: make sure that your name and email change match the exact syntax being used in the spec file: First Name Last Name emailaddress@company.com or else the RPM will not build.
All of the code is on my Github
The curator puppet code listed in this article has been generalized and redacted a bit compared to what is listed on my github. The code on my github, however, has been linted and validated and while it may require some troubleshooting to make it work in your environment, it will be very minimal for even a minimally experience puppet developer.
Curator Backup Monitoring and Alerting: Using Mailx for an Email Alert with Last Log Lines Attached
This tut assumes you have postfix and mailx installed on your CentOS infrastructure because these are effectively the current basic standards for sending email on RHEL-variants. If you don’t you can follow DigitalOcean’s guide on doing so. The guide is for CentOS 6 and also configures Cyrus for SASL and IMAP, but it should get you started.
The cron job code block below is from part 1. The content attribute of the snapshot_alert cron is a short-circuit statement that executes /usr/local/bin/snapshot_alert.sh if curator exits non-zero.
file {'/etc/cron.d/snapshot_alert':
    ensure  => present,
    mode    => '0644',
    content => "${snapshot_actions_cron_schedule} ${snapshot_actions_cron_user} /usr/bin/curator --config /opt/elasticsearch-curator/curator.yml /opt/elasticsearch-curator/snapshot.yml || /bin/bash /usr/local/bin/snapshot_alert.sh\n",
    }
Inside snapshot_alert.sh is a simple bash script that attaches the last 20 lines of the curator.log to an alert email.
#!/bin/bash

snapshot_alert() {
CLUSTER="$(SOME_CALL_TO_ES_API/_cluster/health | jq -r '.cluster_name')"
MAILTO=${MAILTO:-"your_alias@company.com"}
REPLYTO=${REPLYTO:-"${CLUSTER_NAME} <no-reply@company.com>"}

if [ -n "$REPLYTO" ] ; then
    REPLYTO="-r $REPLYTO"
fi

SNAPSHOT_LOG="snapshot-alert-$(date +\%Y\%m\%d-\%s).log"
touch "$SNAPSHOT_LOG"
tail /var/log/elasticsearch-curator/curator.log | jq '.' > "$SNAPSHOT_LOG"

echo 'YOUR ALERT MESSAGE.' | mail -s "ALERT: Curator snapshot job exited with non-zero status" -a "$SNAPSHOT_LOG" "$REPLYTO" "$MAILTO"

exit 0
}
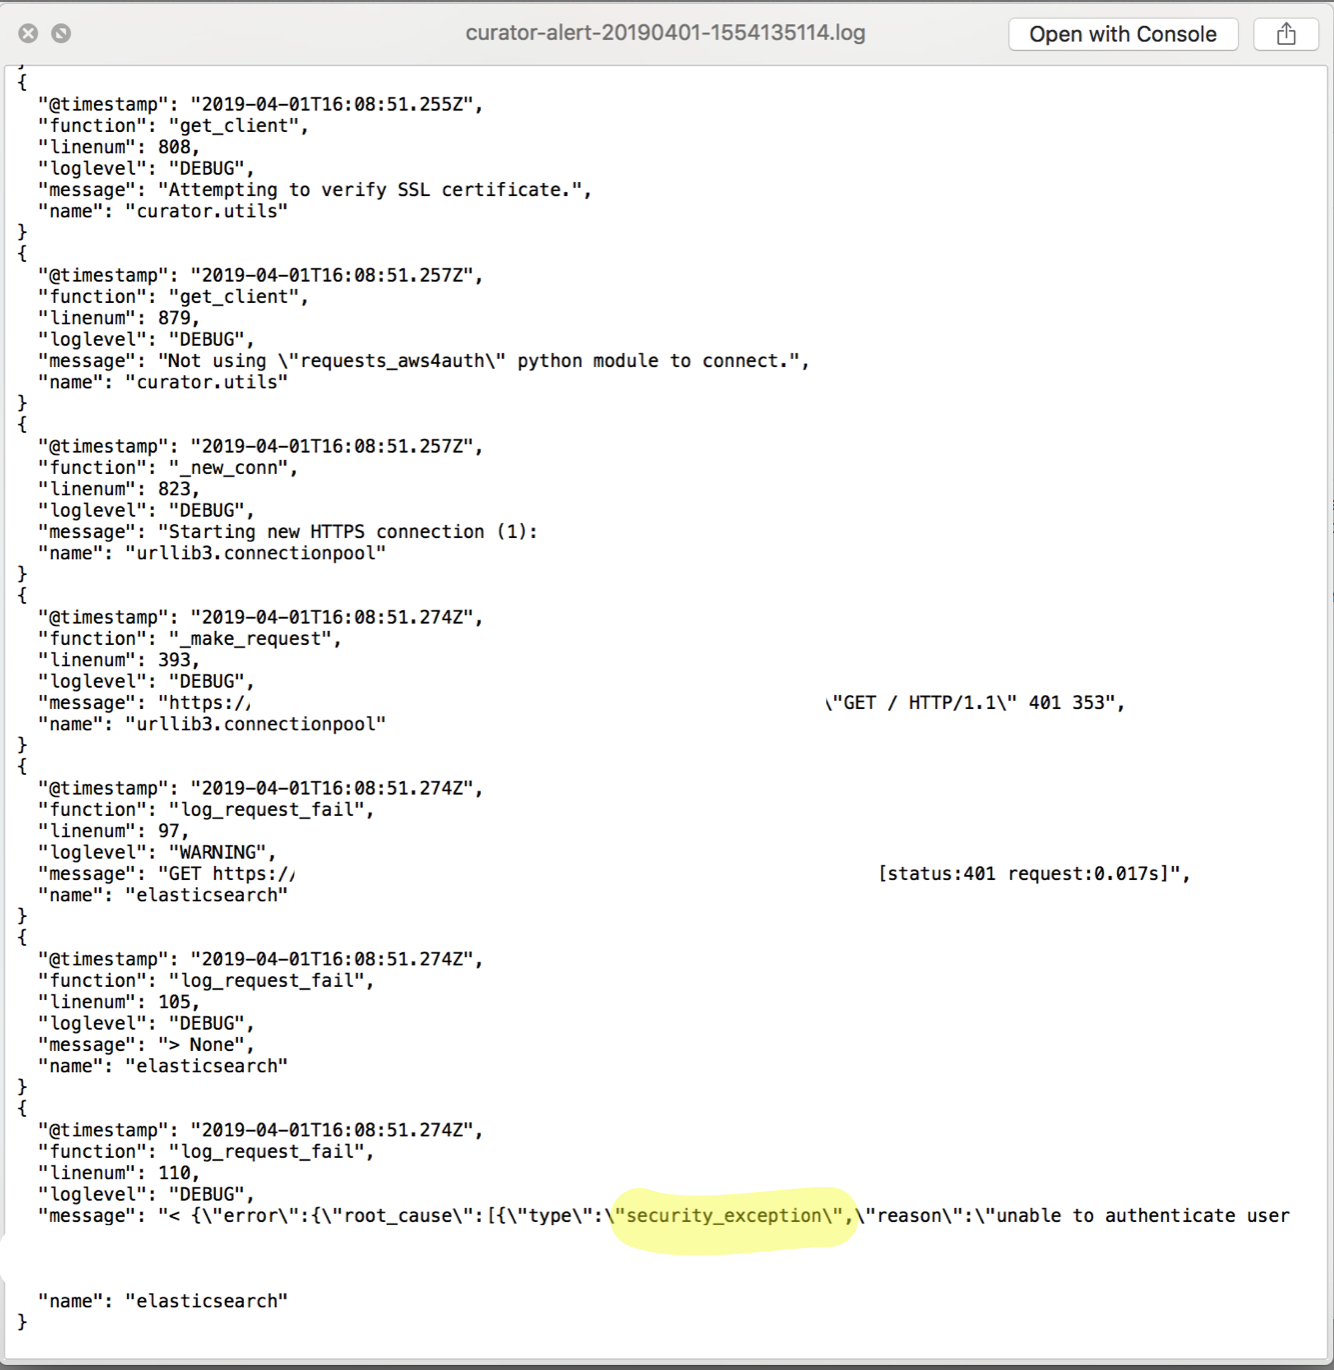
-s is the subject, -a is the log attachment and REPLYTO is the ‘from’ address. The expression date +\%Y\%m\%d-\%s is useful because it makes all log files unique by appending a typical datestamp with the Unix epoch seconds which is useful for analysis and also for shit-hitting-the-fan mode. This script, although only 15 lines or so, served as a great alert for my team. The attached log file is very convenient for a preview before logging into a visualizer like Kibana.
In case it isn’t obvious: this script needs to execute from your cluster masters because they are the only nodes that need Curator installed and will therefore be the only nodes to have curator logs.
Try executing Curator with broken credentials or something similar to test if your alert script and email infrastructure work. If they do you should see something similar to this:
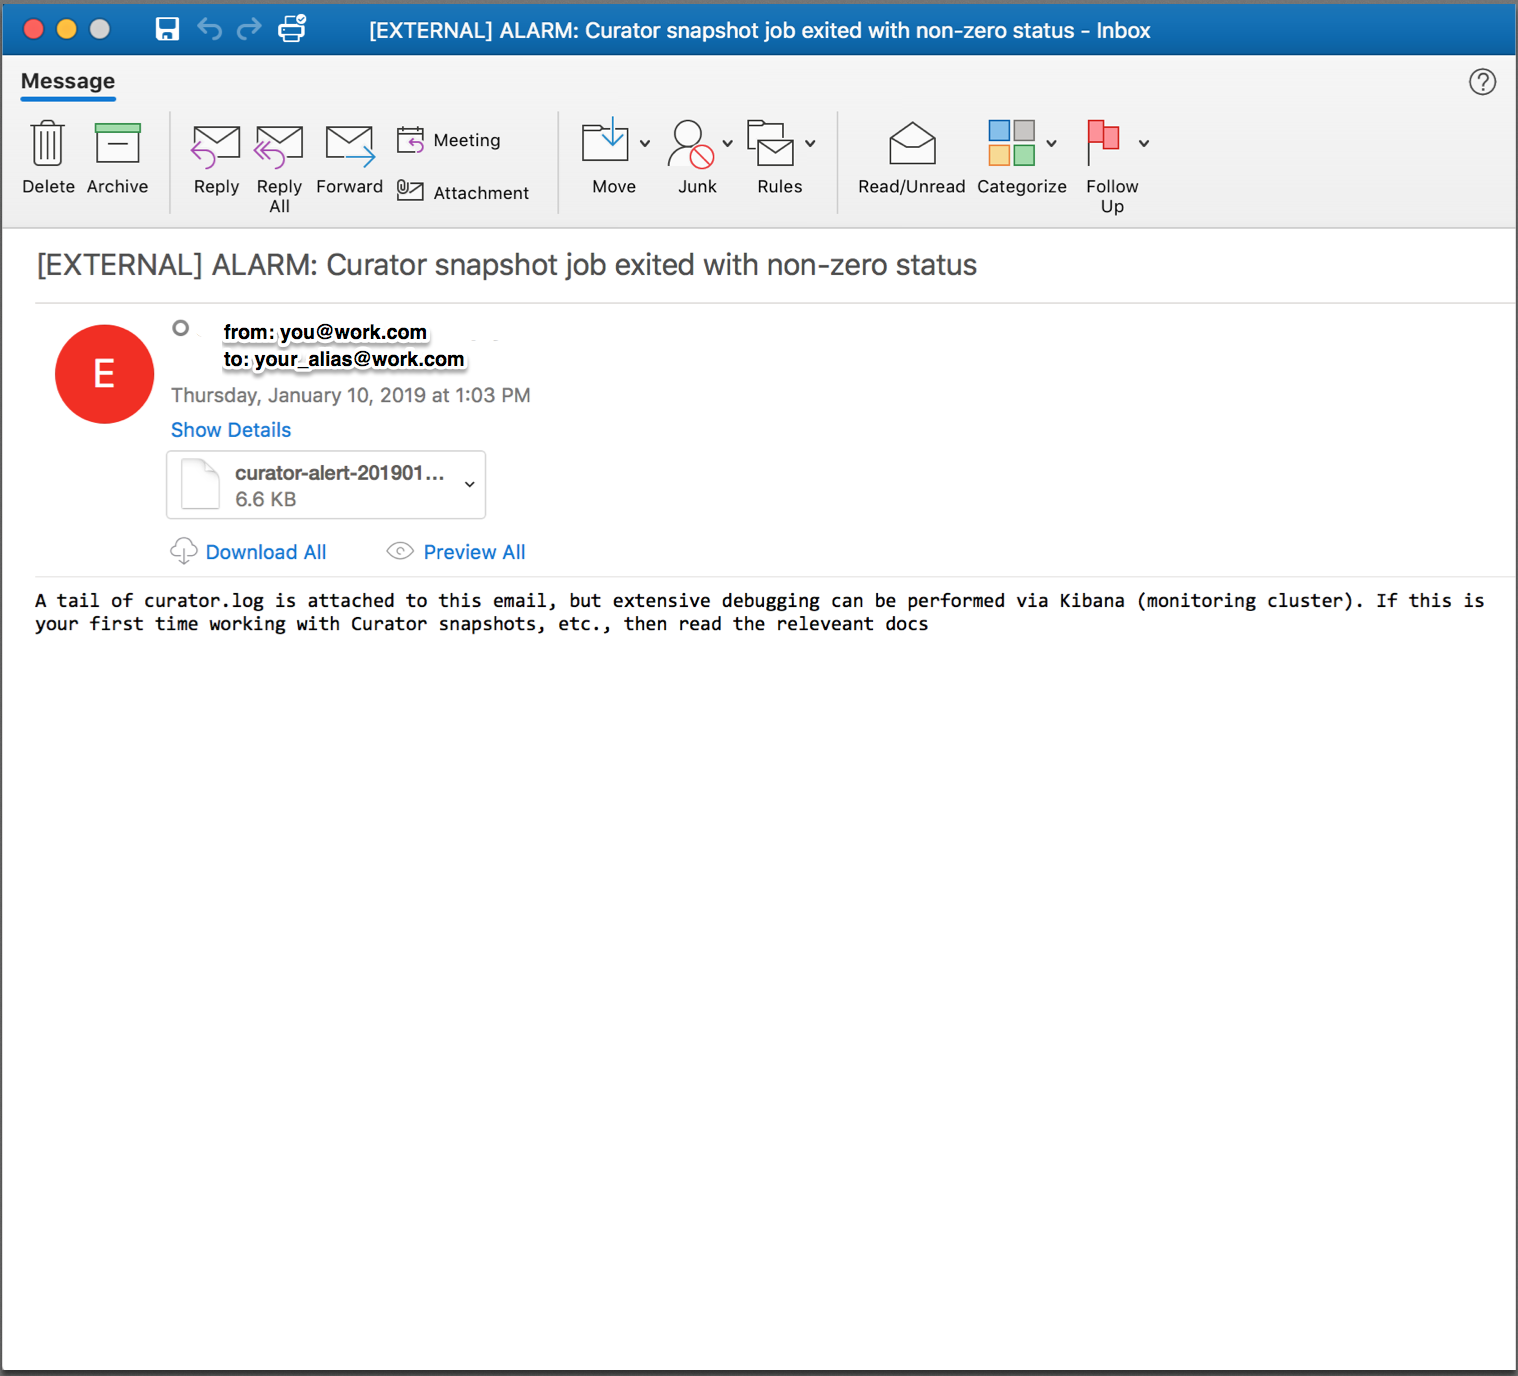
Which has a helpful log file attached so you can preview the errors and contemplate whether or not to possibly dig deeper:
A simple email alert with a log attached is a lot better than nothing, but centralizing curator logs with elasticsearch and visualizing them with Kibana avails me a sinlge UI with which to parse and search curator logs from machines in multiple environments. When snapshots are failing for unknown reasons, which I discuss later on, having a centralized and robust graphical analyzer can prove crucial to resolving complex snapshot failures which is crucial to having confidence in your elasticsearch cluster. If you’re not going to use a visualizer like Kibana then this is effectively the end of the tut and the series for you, although please read the Pro-Tips section at the end. Otherwise:
Curator Backups Monitoring and Alerting: Shipping via a Patched Rsyslog
Elasticsearch 6 implemented strict content-type checking for clarity and security, which is great, except Rsyslog’s omelasticsearch module still uses text/json as its content type which is not allowed; instead application/json must be used. This one word difference breaks Rsyslog’s elasticsearch functionality! Fortunately, patching the Rsyslog source RPM is fairly straightforward:
jonas@devbox ~ $ wget http://vault.centos.org/7.5.1804/os/Source/SPackages/rsyslog-8.24.0-16.el7.src.rpm


--2019-03-30 09:10:51--  http://vault.centos.org/7.5.1804/os/Source/SPackages/rsyslog-8.24.0-16.el7.src.rpm
Resolving vault.centos.org (vault.centos.org)... 208.100.23.71, 2607:f128:40:1600:225:90ff:fe00:bde6
Connecting to vault.centos.org (vault.centos.org)|208.100.23.71|:80... connected.
HTTP request sent, awaiting response... 200 OK
Length: 6778207 (6.5M) [application/x-rpm]
Saving to: ‘rsyslog-8.24.0-16.el7.src.rpm.1’

100%[========================================================================================>] 6,778,207   37.6KB/s   in 9.1s
Now we need to setup an RPM building environment
# get needed packages

# you're going to need gcc, autotools, etc
# feel free to remove all this afterwards

sudo yum groupinstall 'Development Tools'

# rpm-build packages is
# actually called 'rpmbuild'
# when executing from command line

# we need yum-utils (at least) for
# building deps later

sudo yum install yum-utils rpm-build redhat-rpm-config

# now we need to install build dependencies
# required by the rsyslog source RPM
# this installs a number of packages because
# rsyslog builds all of its modules into
# a single RPM

sudo yum-builddep rsyslog-8.24.0-34.el7.x86_64

# create dir structure
# for the build environment

mkdir -p ~/rpmbuild/{BUILD,RPMS,SOURCES,SPECS,SRPMS}

# set the _topdir var for rpmbuild
# this needs to point at the rpmbuild directory
# from the mkdir command above
# as rpmbuild will use this to traverse into the
# various rpm-related directories

echo '%_topdir %(echo $HOME)/rpmbuild' > ~/.rpmmacros

# install via the source rpm

rpm -i rsyslog-8.24.0-16.el7.src.rpm

# untar tar ball because file we need to
# patch is inside it

jonas@devbox ~ $ tar -vzxf rpmbuild/SOURCES/rsyslog-8.24.0.tar.gz -C rpmbuild/SOURCES/
If everything has gone well then you should have an RPM build environment with the rsyslog-8.24.0-16.el7.src.rpm source files structured as below:
jonas@devbox ~ $ ls -R rpmbuild/SOURCES
.:
BUILD  RPMS  rsyslog-8.24.0-16.el7.src.rpm  SOURCES  SPECS  SRPMS

./BUILD:

./RPMS:

./SOURCES:
rsyslog-8.24.0/
rsyslog-8.24.0-doc-polling-by-default.patch                  rsyslog-8.24.0-rhbz1427821-backport-num2ipv4.patch
rsyslog-8.24.0-msg_c_nonoverwrite_merge.patch                rsyslog-8.24.0-rhbz1427821-str2num-emty-string-handle.patch
rsyslog-8.24.0-rhbz1056548-getaddrinfo.patch                 rsyslog-8.24.0-rhbz1427828-set-unset-not-checking-varName.patch
rsyslog-8.24.0-rhbz1088021-systemd-time-backwards.patch      rsyslog-8.24.0-rhbz1431616-pmrfc3164sd-backport.patch
rsyslog-8.24.0-rhbz1165236-snmp-mib.patch                    rsyslog-8.24.0-rhbz1459896-queues-defaults-doc.patch
rsyslog-8.24.0-rhbz1196230-ratelimit-add-source.patch        rsyslog-8.24.0-rhbz1462160-set.statement-crash.patch
rsyslog-8.24.0-rhbz1245194-imjournal-ste-file.patch          rsyslog-8.24.0-rhbz1488186-fixed-nullptr-check.patch
rsyslog-8.24.0-rhbz1303617-imfile-wildcards.patch            rsyslog-8.24.0-rhbz1497985-journal-reloaded-message.patch
rsyslog-8.24.0-rhbz1399569-flushontxend.patch                rsyslog-8.24.0-rhbz1505103-omrelp-rebindinterval.patch
rsyslog-8.24.0-rhbz1400594-tls-config.patch                  rsyslog-8.24.0-rhbz1507028-recover_qi-doc.patch
rsyslog-8.24.0-rhbz1401456-sd-service-network.patch          rsyslog-8.24.0-sd-service.patch
rsyslog-8.24.0-rhbz1401870-watermark.patch                   rsyslog-8.24.0.tar.gz
rsyslog-8.24.0-rhbz1403831-missing-cmd-line-switches.patch   rsyslog.conf
rsyslog-8.24.0-rhbz1403907-imudp-deprecated-parameter.patch  rsyslog-doc-8.24.0.tar.gz
rsyslog-8.24.0-rhbz1419228-journal-switch-persistent.patch   rsyslog.log
rsyslog-8.24.0-rhbz1422414-glbDoneLoadCnf-segfault.patch     rsyslog.sysconfig
rsyslog-8.24.0-rhbz1422789-missing-chdir-w-chroot.patch

./SPECS:
rsyslog.spec

./SRPMS:
If you want to dig deeper here are the main resources I used:
Curator Backups Monitoring and Alerting: Patching Rsyslog
Now we need patch files that will make rsyslog use strict Content-Type checking. The first file rsyslog-8.24.0-rhbz1600171-omelasticsearch-strict-content-type-for-es.patch goes in the ~/rpmbuild/SOURCES dir; the second file spec.patch can go in $HOME. The md5sums of these files are bb63628eb31625708b2bfa and a0e7fa26cf71bf55fff37b54649a7041, respectively. Make sure these md5sums stay the same because introducing any changes into them will most likely break the RPM build: I am speaking from painful personal experience!
rsyslog-8.24.0-rhbz1600171-omelasticsearch-strict-content-type-for-es.patch
Inside spec.patch edit line 32 if you wish and enter the current date and an email; IMPORTANT: use the exact format that is currently being used or the RPM will not build. Also, on lines 7 and 8 is:
-Release: 16%{?dist}
+Release: 16%{?dist}.1
The .1 is accounting for the logically resultant minor version bump post-RPM build. There is actually a fair amount of thought given to RPM versioning and you can read about Fedora’s in the RPM Versioning link above.
Now we need to patch the rsyslog rsyslog.spec file with the spec.patch file:
patch -i spec.patch rpmbuild/SPECS/rsyslog.spec
Now build the RPM:
# this takes a minute or two

rpmbuild -ba rpmbuild/SPECS/rsyslog.spec
After the rpmbuild finishes you’ll have a source RPM:
jonas@devbox ~ $ ls rpmbuild/SRPMS/
rsyslog-8.24.0-16.el7.1.src.rpm
and the entire rsyslog artifact RPM catalog:
jonas@devbox ~ $ ls rpmbuild/RPMS/x86_64/
rsyslog-8.24.0-16.el7.1.x86_64.rpm                rsyslog-mmjsonparse-8.24.0-16.el7.1.x86_64.rpm
rsyslog-crypto-8.24.0-16.el7.1.x86_64.rpm         rsyslog-mmnormalize-8.24.0-16.el7.1.x86_64.rpm
rsyslog-debuginfo-8.24.0-16.el7.1.x86_64.rpm      rsyslog-mmsnmptrapd-8.24.0-16.el7.1.x86_64.rpm
rsyslog-elasticsearch-8.24.0-16.el7.1.x86_64.rpm  rsyslog-mysql-8.24.0-16.el7.1.x86_64.rpm
rsyslog-gnutls-8.24.0-16.el7.1.x86_64.rpm         rsyslog-pgsql-8.24.0-16.el7.1.x86_64.rpm
rsyslog-gssapi-8.24.0-16.el7.1.x86_64.rpm         rsyslog-relp-8.24.0-16.el7.1.x86_64.rpm
rsyslog-libdbi-8.24.0-16.el7.1.x86_64.rpm         rsyslog-snmp-8.24.0-16.el7.1.x86_64.rpm
rsyslog-mmaudit-8.24.0-16.el7.1.x86_64.rpm        rsyslog-udpspoof-8.24.0-16.el7.1.x86_64.rpm
You can use all of these minor-bumped RPMs or only rsyslog-8.24.0-16.el7.1.x86_64.rpm. Whatever the case we will be using the rsyslog-related RPMs below:
rsyslog-mmjsonparse-8.24.0-16.el7.some_version.x86_64
rsyslog-8.24.0-16.el7.1.x86_64
rsyslog-elasticsearch-8.24.0-16.el7.some_version.x86_64
rsyslog-gnutls-8.24.0-16.el7.some_version.x86_64
rsyslog-relp-8.24.0-16.el7.some_version.x86_64
…for massaging curator logs into a json-like format that elasticsearch can ingest and also for handling TLS.
Now that we have patched rsyslog we can use it to ship Curator logs to elasticsearch, but first we need to deploy and configure rsyslog to do so.
Curator Backup Monitoring and Alerting: Deploying and versionlocking Rsyslog with Puppet
This section may not fully apply to your team because maybe you’re not using Puppet to deploy and configure Rsyslog. Even if you’re not, be mindful of other applications (Chef, CFEngine, whatever) removing your patched rsyslog RPM for another one. One way to deal with this is to use yum versionlock which you can read about here.
The manifest below deploys Rsyslog and prevents anything from removing it. It’s not the prettiest, for example it’s better not to exec yum remove 'rsyslog*' which I have done due to kludgyness in my own environment, but that block as been tested fairly thoroughly and it works fine. Remove values like $curator_elb if needed. Regarding TLS this is another very convenient case for assigning $curator_cacert to a Puppet master’s root cert and $curator_cert and $curator_key to the same Puppet master’s client-side x.509 certificate and private key which was discussed in part 1. We assign the $curator_cert and $curator_key values to the cert and key of the various masters because Curator only runs on the master, whereas normally these values would refer to a puppet client’s cert and private key.
class rsyslog (
  $curator_log_file  					 = '/var/log/elasticsearch-curator/curator.log',
  $curator_elb       					 = undef,
  $curator_elb_port  					 = '9200',
  $curator_cacert    					 = undef,
  $curator_cert      					 = undef,
  $curator_key       					 = undef,
  $curator_username  					 = undef,
  $curator_password  					 = undef,
  $curator_bulkmode  					 = 'on',
  $curator_batchsize 					 = '500',
  $curator_queuesize 					 = '10000',
  $curator_threads   					 = '2',
  $curator_retries   					 = '-1',
  $curator_rsyslog_rpm_version = '8.24.0-16.el7.1.x86_64',
  ){

  if $::fqdn =~ /^$your_domain_convention/ {

    $curator_packages = ["rsyslog-mmjsonparse-${curator_rsyslog_rpm_version}", "rsyslog-elasticsearch-${curator_rsyslog_rpm_version}"]

    file { '/etc/rsyslog.d/11-curator-elasticsearch.conf':
      ensure  => present,
      content => template("${module_name}/11-curator-elasticsearch.conf.erb"),
    }

    exec { "yum remove -y 'rsyslog*'":
      path   => ['/usr/bin'],
      unless => 'rpm -qa | grep -q rsyslog-8.24.0-16.el7.1.x86_64',
    } ~> package { 'yum-plugin-versionlock':
      ensure => 'latest',
    } ~> exec { "yum versionlock rsyslog-*${curator_rsyslog_rpm_version}":
      path => ['/usr/bin/', '/sbin/'],
    } -> package { $curator_packages:
      ensure => 'latest',
    }

  }

}
The $packages line installs the mmjsonparse and elasticsearch rsyslog module RPMs, which triggers the install of the gnutls and relp module RPMS, all of which are needed to handle fully-duplexed TLS connections from curator to elasticsearch. If you’re not using Puppet to deploy and configure rsyslog make sure to install these other packages.
Curator Backup Monitoring and Alerting: Templatizing Rsyslog’s Configuration file
Rsyslog is part of any RHEL-variant and this tut’s additional configuration below should work with any RHEL-variant’s base rsyslog.conf file. If for some reason your rsyslog.conf is not a base install then I assume that you or someone on your team has some experience with rsyslog and will be able to make any changes necessary. Similarly, if you change or remove anything in the ERB template below but the ERB variables themselves or code related to those variables then good luck to you: the rsyslog documentation is pretty extensive, but not 100% clear.
The configuration grabs every event and every piece of every event’s metadata; in other words it ships everything in the curator logs to elasticsearch. This is a time series process that creates indices in the curator-YYYY-MM-DD format and rsyslog knows when to create a new index after a date change has occurred. I recommend telling Curator to purge logs older than a certain date which can be read about here and here. As for the rsyslog configuration itself I list two excellently related sources in the comments.
This file should almost certainly be in the /etc/rsyslog.d dir.
# source: https://serverascode.com/2016/11/11/ryslog-to-elasticsearch.html
# source: https://techpunch.co.uk/development/how-to-shop-json-logs-via-rsyslog
# pro-tip: order of directives such as templates and ruleset
# that call template (and likely other directives) matters
# in rsyslog.

module(load="omelasticsearch")
module(load="mmjsonparse")
module(load="imfile")

# ingest the curator file
input(type="imfile"
   File="<%= @curator_log_file %>"
   Tag="curator-events"
   addMetadata="on"
   ruleset="curatorToElasticsearchRuleset"
)

# template to generate JSON documents for Elasticsearch in curator format
template(name="curatorLogTemplate"
   type="list") {
   constant(value="{ ")
   constant(value="\"type\":\"")
   property(name="programname")
   constant(value="\", ")
   constant(value="\"host\":\"")
   property(name="hostname")
   constant(value="\", ")
   constant(value="\"sourcefile\":\"")
   property(name="$!metadata!filename")
   constant(value="\", ")
   property(name="$!all-json" position.from="2")
}

# formats index names as curator-YYYY-MM-DD
template(name="curator-index"
  type="list") {
    constant(value="curator-")
    property(name="timereported" dateFormat="rfc3339" position.from="1" position.to="4")
    constant(value=".")
    property(name="timereported" dateFormat="rfc3339" position.from="6" position.to="7")
    constant(value=".")
    property(name="timereported" dateFormat="rfc3339" position.from="9" position.to="10")
}

ruleset(name="curatorToElasticsearchRuleset") {
    action(type="mmjsonparse" cookie="")
    action(type="omelasticsearch"
      server="<%= @curator_elb %>"
      serverport="<%= @curator_elb_port %>"
      usehttps="on"
      tls.cacert="<%= @curator_cacert %>"
      tls.mycert="<%= @curator_cert %>"
      tls.myprivkey="<%= @curator_key %>"
      uid="<%= @curator_username %>"
      pwd="<%= @curator_password %>"
      template="curatorLogTemplate"
      searchIndex="curator-index"
      dynSearchIndex="on"
      searchType="events"
      bulkmode="<%= @curator_bulkmode %>"                # use the Bulk API
      queue.dequeuebatchsize="<%= @curator_batchsize %>" # ES bulk size
      queue.size="<%= @curator_queuesize %>"             # capacity of the action queue
      queue.workerthreads="<%= @curator_threads %>"      # num of workers for the action
      action.resumeretrycount="<%= @curator_retries %>"  # retry indefinitely if ES is unreachable
      errorfile="/var/log/rsyslog-curator-error.log"
    )
    stop
}

# debugging
$DebugFile /var/log/rsyslog-debug.log
$DebugLevel 2
The config writes debug to /var/log/rsyslog-debug.log at debug level 2 which is full debug; 0 is off and 1 is ‘demand activity’. Read about rsyslog debugging here. Another very helpful rsyslog debug command is:
rsyslogd -N1
Tailing /var/log/rsyslog-debug.log should be quite insightful as to whether or not rsyslog is able to ship to elasticsearch. For example, if the log file you’re attempting to ingest doesn’t exist you might see something like:
2924.419291019:main Q:Reg/w0  : main Q:Reg/w0: worker IDLE, waiting for work.

2934.405625872:imfile.c       : file '/var/log/elasticsearch-curator/curator.lo' opened as #-1 with mode 384

2934.405660661:imfile.c       : strm 0x7f95f40020c0: open error 2, file '/var/log/elasticsearch-curator/curator.lo': No such file or directory

2944.415070349:imfile.c       : file '/var/log/elasticsearch-curator/curator.lo' opened as #-1 with mode 384

2944.415098226:imfile.c       : strm 0x7f95f40020c0: open error 2, file '/var/log/elasticsearch-curator/curator.lo': No such file or directory
With some squinting rsyslog-debug.log will also show when everything is working:
6381.089160417:main Q:Reg/w0  : processBATCH: next msg 4: {"@timestamp": "2019-03-01T23:52:59.719Z", "function": "log_request_success", "linenum": 86, "loglevel": "DEBUG", "message": "<
6381.089163406:main Q:Reg/w0  :     ACTION 0 [mmjsonparse:action(type="mmjsonparse" ...)]
6381.089170492:main Q:Reg/w0  : executing action 0
6381.089173876:main Q:Reg/w0  : action 'action 0': called, logging to mmjsonparse (susp 0/0, direct q 1)
6381.089177318:main Q:Reg/w0  : Action 0 transitioned to state: itx
6381.089194969:main Q:Reg/w0  : entering actionCalldoAction(), state: itx, actionNbr 0
6381.089206267:main Q:Reg/w0  : mmjsonparse: toParse: '{"@timestamp": "2019-03-01T23:52:59.719Z", "function": "log_request_success", "linenum": 86, "loglevel": "DEBUG", "message": "< {\"snapshots\":[{\"snapshot\":\"domain.com-20190301235236\"

...

6381.089379956:main Q:Reg/w0  : Action 0 transitioned to state: rdy
6381.089390462:main Q:Reg/w0  : action 'action 0': set suspended state to 0
6381.089393718:main Q:Reg/w0  :     ACTION 1 [omelasticsearch:action(type="omelasticsearch" ...)]
6381.089406465:main Q:Reg/w0  : executing action 1
6381.089414707:main Q:Reg/w0  : action 'action 1': called, logging to omelasticsearch (susp 0/0, direct q 1)
6381.089483784:main Q:Reg/w0  : action 'action 1': is transactional - executing in commit phase

...

6901.565868820:main Q:Reg/w0  : omelasticsearch: checkConn(https://es_cluster:9200/) completed with success on attempt 0
6901.565900813:main Q:Reg/w0  : omelasticsearch: using REST URL: 'https://es_cluster:9200/_bulk'
6901.573745733:main Q:Reg/w0  : omelasticsearch: pWrkrData replyLen = '3656'
6901.573771695:main Q:Reg/w0  : omelasticsearch: pWrkrData reply: '{"took":4,"errors":false,"items":[{"index":{"_index":"curator-2019.03.01"
When the debug log looks healthy try _cat‘ing the curator indices on your cluster:
jonas@es_cluster ~ $ sudo curl -skn https://$(hostname -f):9200/_cat/indices?v | awk '{ print $3 }' | sort -n
curator-2019.02.26
curator-2019.02.27
curator-2019.02.28
curator-2019.03.01
The attached log file above reported that Curator failed with a security_exception. Click the image below to enlarge the screenshot of the Kibana ‘discovery’ UI.
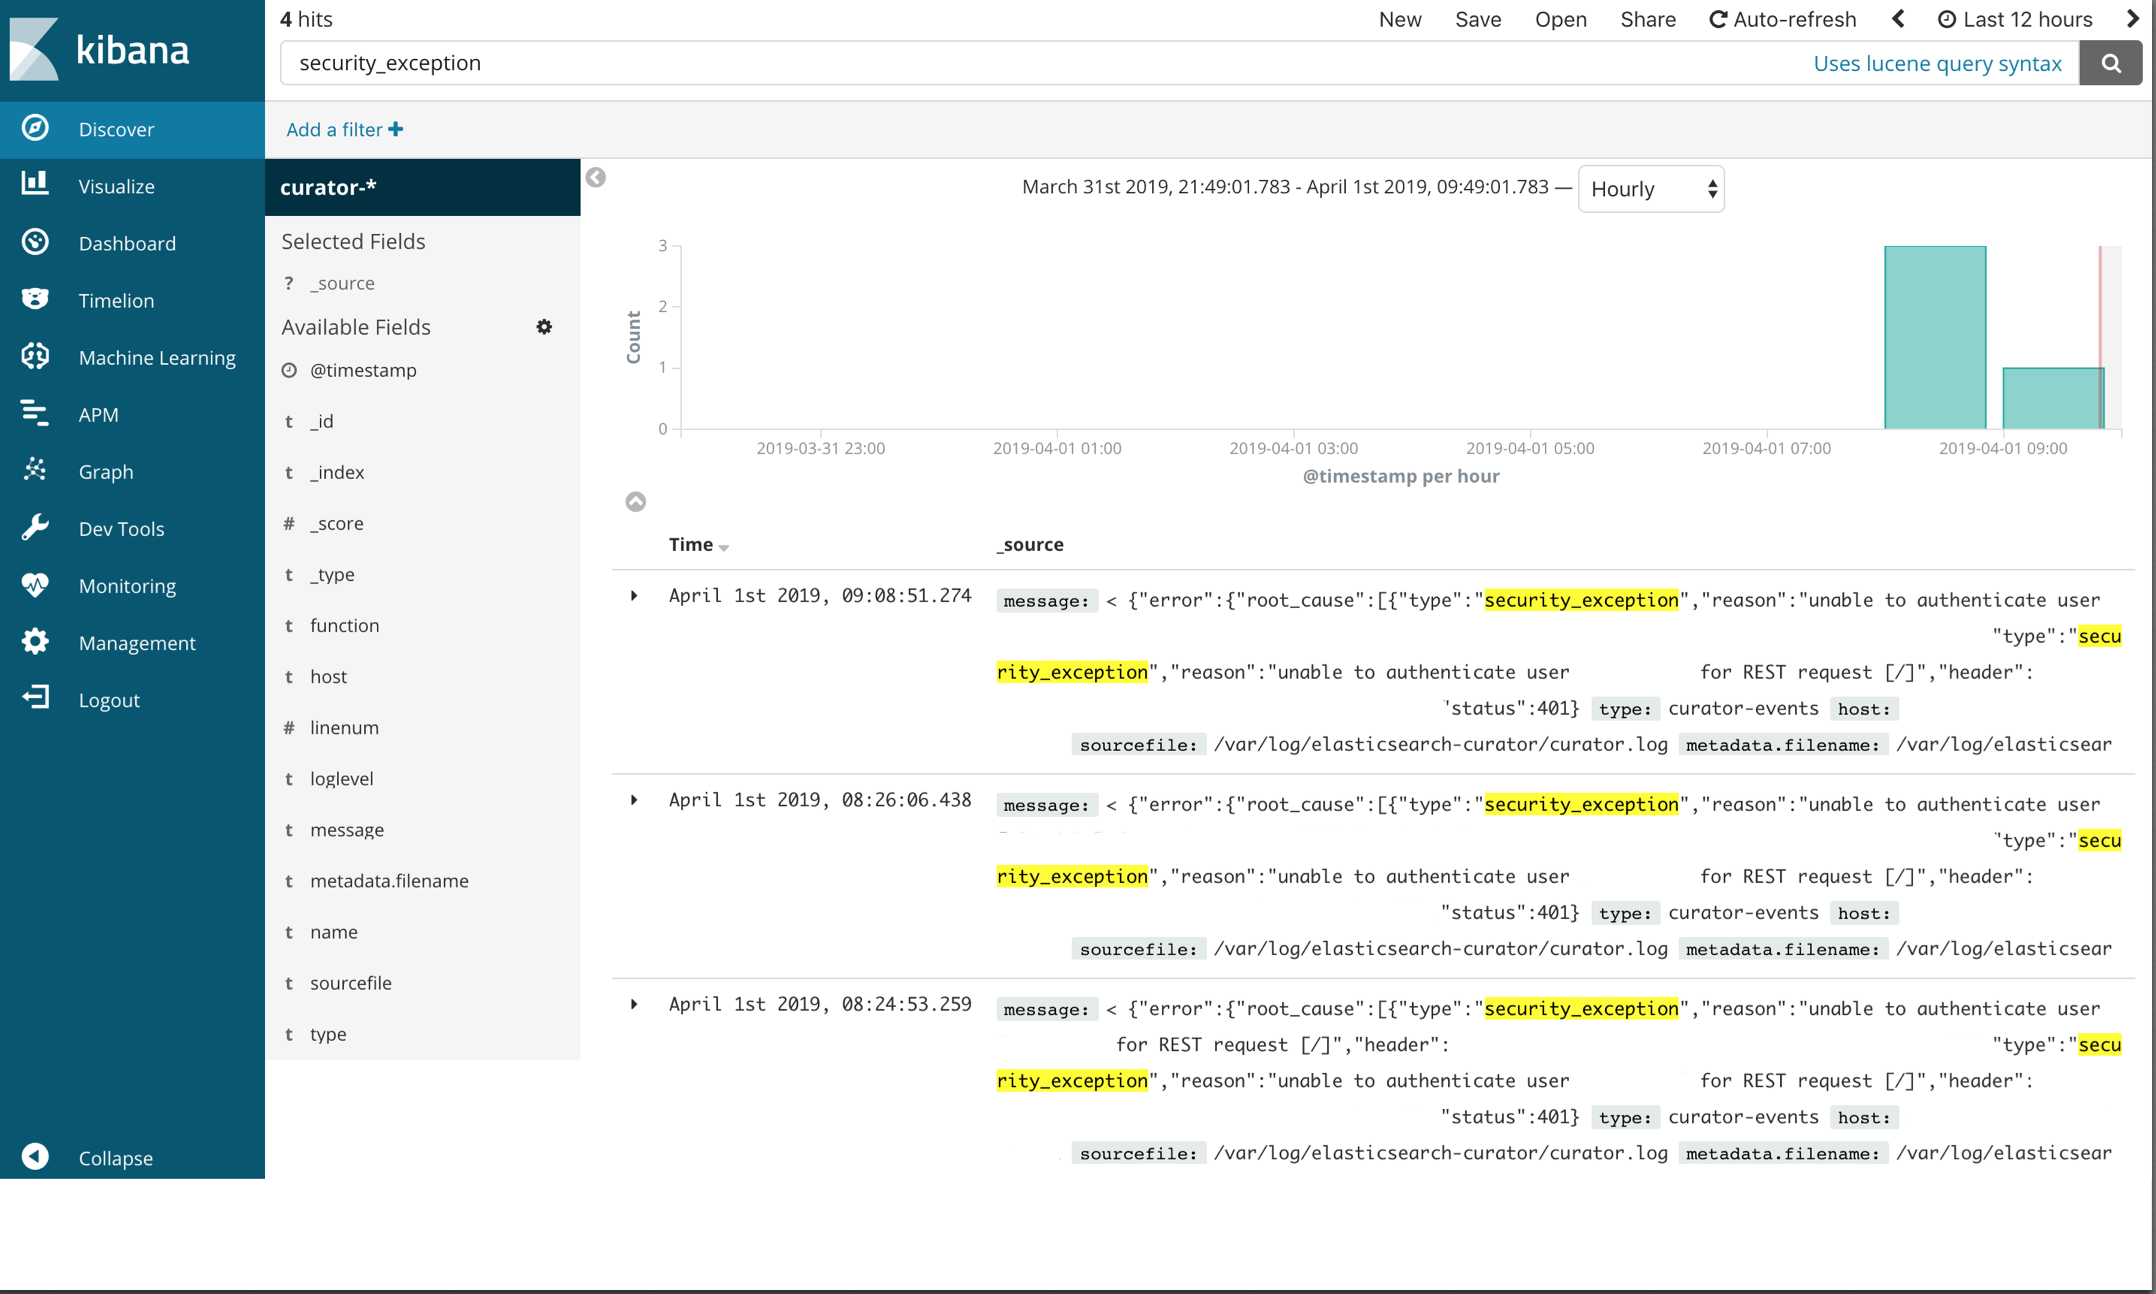
The ‘security_exception’ example isn’t a great one to demonstrate the necessity of Kibana analysis because it’s a trivial error to solve: it says right in the error unable to authenticate user [user], but there are more complex failure scenarios in which a visualizer like Kibana is very helpful. Unfortunately I don’t have a nice Kibana screenshot of this because it has been solved within my systems and those elasticsearch events have long been purged, but I do have logs from that time. Imagine something like this:
{
  "@timestamp": "2019-01-10T21:02:15.048Z",
  "function": "snapshot_check",
  "linenum": 1553,
  "loglevel": "WARNING",
  "message": "Snapshot my-aws-s3-20190110210002 completed with state PARTIAL.",
  "name": "curator.utils"
}
{
... # whole lot of metadata

... # relevant bit

"IndexShardSnapshotFailedException[error deleting index file [pending-index-3] during cleanup]; nested: NoSuchFileException[Blob [pending-index-3] does not exist]; \",\"node_id\":\"some_node_id\",\"status\":\"INTERNAL_SERVER_ERROR\"}],\"shards\":{\"total\":395,\"failed\":2,\"successful\":393}}]}",
}
{
  "@timestamp": "2019-01-10T21:02:15.105Z",
  "function": "report_state",
  "linenum": 1498,
  "loglevel": "ERROR",
  "message": "Snapshot PARTIAL completed with state: PARTIAL",
  "name": "curator.actions.snapshot"
}
{
  "@timestamp": "2019-01-10T21:02:15.105Z",
  "function": "run",
  "linenum": 186,
  "loglevel": "ERROR",
  "message": "Failed to complete action: snapshot.  <class 'curator.exceptions.FailedExecution'>: Exception encountered.  Rerun with loglevel DEBUG and/or check Elasticsearch logs for more information. Exception: Snapshot PARTIAL completed with state: PARTIAL",
  "name": "curator.cli"
}
In the end NoSuchFileException[Blob [pending-index-3] does not exist] was caused by a curator delete index action job that was breaking my snapshot action: the snapshot was kicking off first and then the delete index action would run and snapshot wouldn’t be able to find an index that its metadata said should be there. With multiple host environments and multiple different deployments of elasticsearch a log attached to an email wasn’t effective and Kibana analysis gave me the visual insight I needed to resolve the snapshot failures by mapping IndexShardSnapshotFailedException times with machines in multiple environments.
Curator Backup Monitoring and Alerting Bonus Section: An X-Pack Watcher Example that Triggers when “Security Exception … Unable to Authenticate User” Condition is Met
Because X-Pack Watchers are native to elasticsearch it means that you can stop managing alert scripts through your data clusters and although the programmatic capabilities of them aren’t more expansive than Bash, let’s be honest: writing alert scripts in Bash is probably a bit of a legacy approach at this point; if you have a paid elasticsearch license, I highly recommend using Watchers. Only a simple example of triggering a Watcher due to a security_exception ... unable to authenticate user exception is covered, but the Watchers documentation is very good and this should be enough to get you started.
Watchers are scripts written in json that are installed to elasticsearch via the _xpack/watcher API. There are five basic sections to a watch: trigger’s specify when to run the alert; inputs’s load data that the watch is going to execute like a a query against our curator-YYYY.MM.DD indices; condition’s determine whether or not to execute the watch; action’s specify alert type, e.g. jira, slack or in our case email; transform’s modify how the watch payload is processed by the action. Dig deeper into each section here
I highly recommend using the Kibana Dev Tools UI to install your watchers; this is one case where a web frontend outdoes curl:

The watcher example code is too long to capture a watcher install from the Kibana dev tools UI in a screenshot, but all that needs to be done is: access Kibana, select dev tools, copy-and-paste the code, update the values to match your system and press the play button.
{
  "trigger": {
    "schedule": {
      "hourly": {
        "minute": [
          59
        ]
      }
    }
  },
  "input": {
    "search": {
      "request": {
        "search_type": "query_then_fetch",
        "indices": [
          "<curator-{now/d{YYYY.MM.dd}}>"
        ],
        "types": [],
        "body": {
          "size": 20,
          "query": {
            "bool": {
              "must": {
                "query_string": {
                  "query": "message : security_exception unable to authenticate user",
                  "analyze_wildcard": true,
                  "default_field": "*"
                }
              },
              "filter": [
                {
                  "range": {
                    "@timestamp": {
                      "gte": "now-1h"
                    }
                  }
                }
              ]
            }
          }
        }
      }
    }
  },
  "condition": {
    "compare": {
      "ctx.payload.hits.total": {
        "gt": 0
      }
    }
  },
  "actions": {
    "send_email_notification": {
      "throttle_period_in_millis": 14400000,
      "email": {
        "profile": "standard",
        "attachments": {
          "data.yml": {
            "data": {
              "format": "yaml"
            }
          }
        },
        "priority": "high",
        "to": [
          "jsteinberg@mmm.com"
        ],
        "subject": "{{ctx.metadata.email_subject}}",
        "body": {
          "html": "<!DOCTYPE html><html><body><h2>{{ctx.metadata.email_body_header}}<p>Security Exception Received Monitoring Cluster from DI -- {{ctx.payload.hits.total}} Events Received </h2><small><p>Executed watch [{{ctx.watch_id}}] at [{{ctx.execution_time}}].<p>Do not reply to this email. The sending account is not monitored.</small></body></html>"
        }
      }
    }
  },
  "metadata": {
    "email_body_header": "Monitoring Cluster Security Exception Alert - DI Environment",
    "email_subject": "Monitoring Cluster Security Exception Alert - DI Environment"
  }
}
Debugging is also a lot easier in the dev tools UI as opposed to accessing the watchers indices directly via curl.
The trigger section specifies that this watcher will execute on the 59th minute of every hour. The input is of type search which supports the full elasticsearch query DSL; in other words it’s a _search API request. Basically this section says for the last 4 hours search every document on every index like curator-YYYY.MM.DD for a substring of message : security_exception unable to authenticate user. size: 20 specifies how many results to return. To understand exactly what’s going on in this part of the watcher you can read the following documentation:
The condition section specifies that if our query matches anything, we want to be alerted. The action section specifies whom to alert, handles some basic web templating and attaches matching records equal to size: 20 to the email in a yaml file. The option metadata section lends logic to our action section.
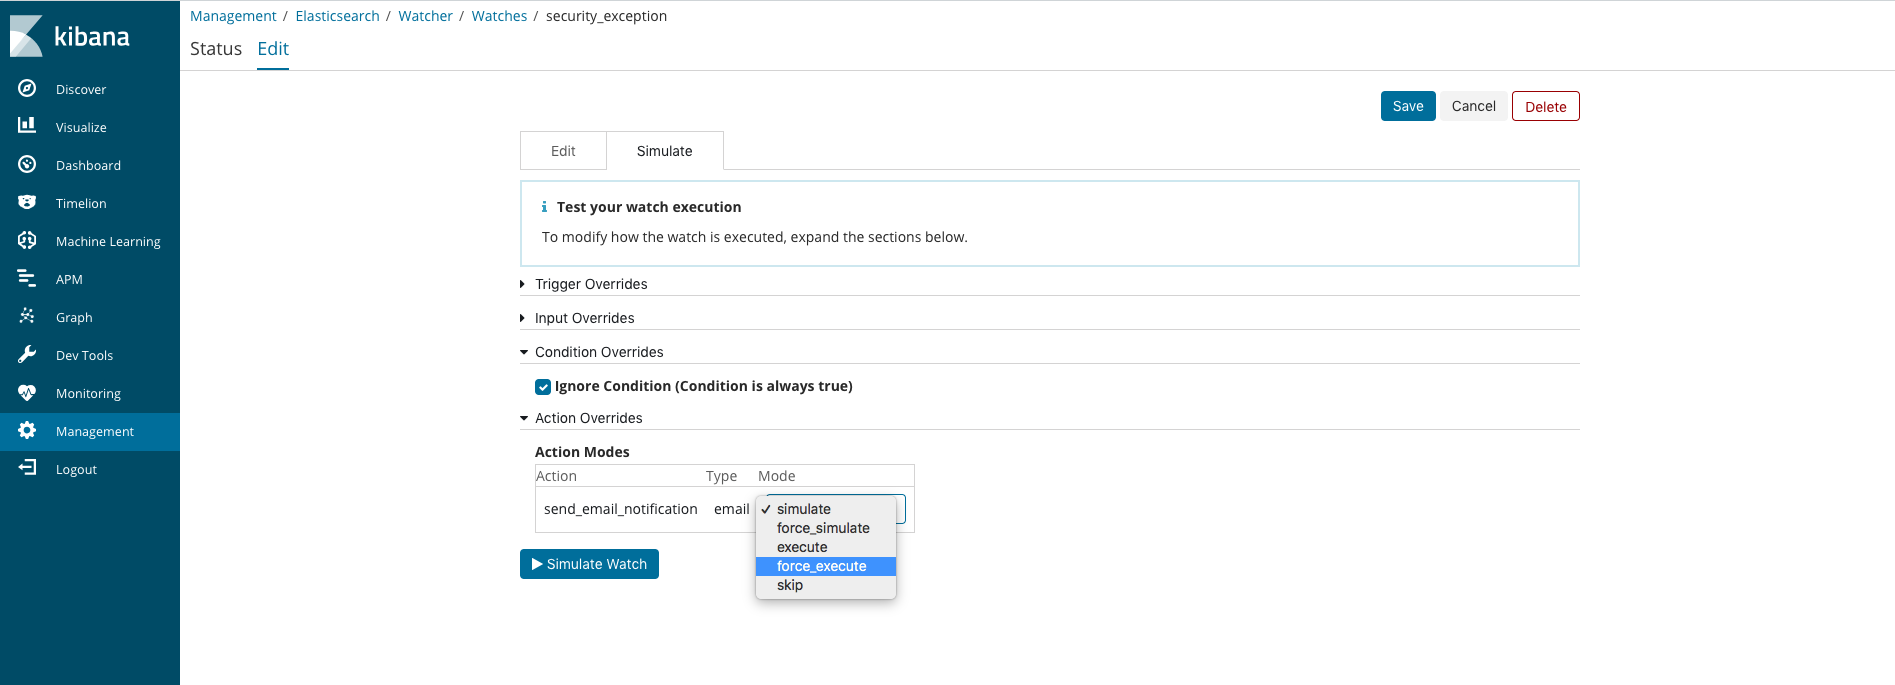
After installing your updated watcher via the dev tools UI you can force an execution of it by going to the Watcher section in the Management UI. From there search for your watcher by name, click on the watcher link and select the Edit tab at the top of the page. On the Edit page select the Simluate tab. From there select a Condition Override of Ignore Condition and an Action Override of force execution.
If you receive an email alert like the one below then your watcher is installed and working:
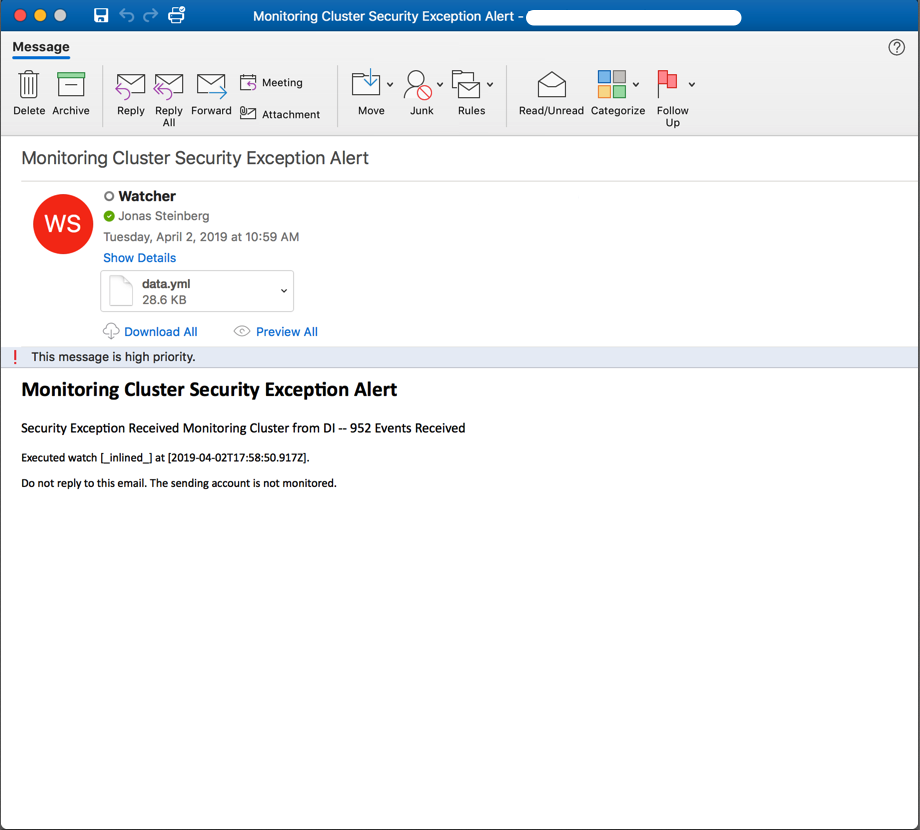
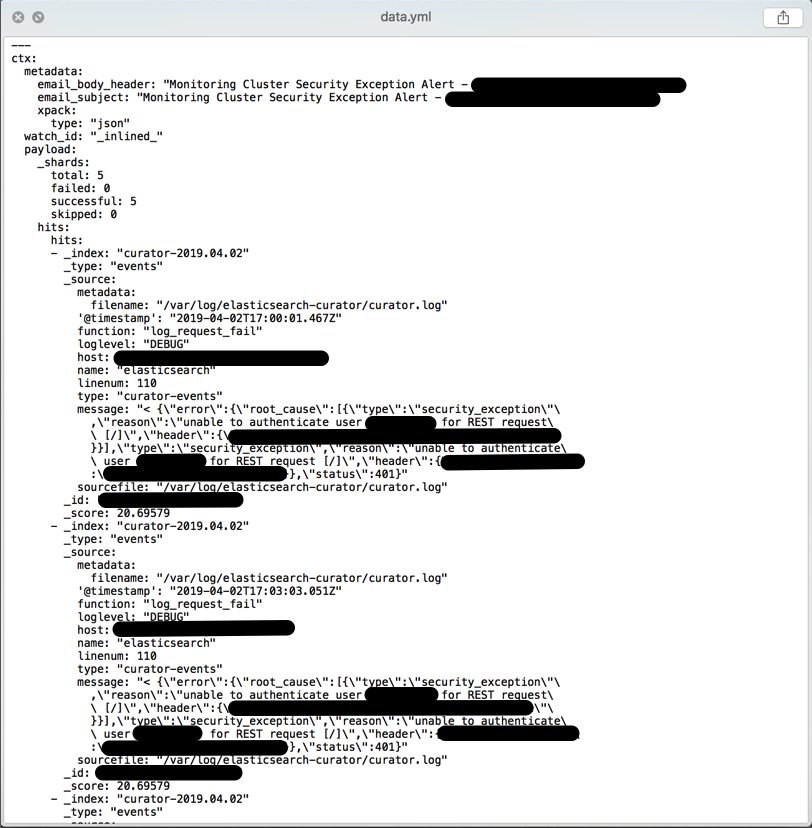
If a yaml file of matching records is attached then your query produced matches; if not then uncheck the Ignore Condition override and play with your query substring until you are receiving matched records containing data of some utility:
Reminder: Test Your Alerts (Duh)!
It doesn’t make sense to have alerts if they don’t trigger against what is being specified or if when they do trigger they don’t provide much utility, e.g. they aren’t descriptive enough, attached log files don’t have useful data, etc. So whether or not you use Watchers or further develop the bash approach do yourself and your team a favor by verifying that alerts are occurring when they are supposed to and at a frequency that isn’t going to blow up the email servers.
Conclusion
Centralizing and alerting on Curator logs is crucial to being able to have confidence in your cluster snapshots and there really isn’t too much that needs to be added to that claim lol. Although patching Rsyslog is kludgy, there is something nice about not needing to add another package across your infrastructure, even if elastic’s Filebeats is free and easy to use. If you’ve skimmed through this and it seems relevant go to my github and look at the code; if you’re in the middle of something similar and want advice feel free to email or tweet me because I’d be happy to lend a set of ears and impart any knowledge I have that may be relevant.